Prometheus是一个开源监控系统,它前身是SoundCloud的警告工具包。从2012年开始,许多公司和组织开始使用Prometheus。该项目的开发人员和用户社区非常活跃,越来越多的开发人员和用户参与到该项目中。目前它是一个独立的开源项目,且不依赖与任何公司。 为了强调这点和明确该项目治理结构,Prometheus在2016年继Kurberntes之后,加入了Cloud Native Computing Foundation。
总览
特征
Prometheus的主要特征有:
- 多维度数据模型
- 灵活的查询语言
- 不依赖分布式存储,单个服务器节点是自主的
- 以HTTP方式,通过pull模型拉去时间序列数据
- 也通过中间网关支持push模型
- 通过服务发现或者静态配置,来发现目标服务对象
- 支持多种多样的图表和界面展示,grafana也支持它
组件
Prometheus生态包括了很多组件,它们中的一些是可选的:
- 主服务Prometheus Server负责抓取和存储时间序列数据
- 客户库负责检测应用程序代码
- 支持短生命周期的PUSH网关
- 基于Rails/SQL仪表盘构建器的GUI
- 多种导出工具,可以支持Prometheus存储数据转化为HAProxy、StatsD1. 、Graphite等工具所需要的数据存储格式
- 警告管理器
- 命令行查询工具
- 其他各种支撑工具
多数Prometheus组件是Go语言写的,这使得这些组件很容易编译和部署。
架构图
下面这张图说明了Prometheus的整体架构,以及生态中的一些组件作用:
Prometheus服务,可以直接通过目标拉取数据,或者间接地通过中间网关拉取数据。它在本地存储抓取的所有数据,并通过一定规则进行清理和整理数据,并把得到的结果存储到新的时间序列中,PromQL和其他API可视化地展示收集的数据
适用场景
Prometheus在记录纯数字时间序列方面表现非常好。它既适用于面向服务器等硬件指标的监控,也适用于高动态的面向服务架构的监控。对于现在流行的微服务,Prometheus的多维度数据收集和数据筛选查询语言也是非常的强大。
Prometheus是为服务的可靠性而设计的,当服务出现故障时,它可以使你快速定位和诊断问题。它的搭建过程对硬件和服务没有很强的依赖关系。
不适用场景
Prometheus,它的价值在于可靠性,甚至在很恶劣的环境下,你都可以随时访问它和查看系统服务各种指标的统计信息。 如果你对统计数据需要100%的精确,它并不适用,例如:它不适用于实时计费系统。
词汇表
Alert(警告)
警告是Prometheus服务正在激活警报规则的结果。警报将数据从Prometheus服务发送到警告管理器
(Alertmanager)警告管理器
警告管理器接收警告,并把它们聚合成组、去重复数据、应用静默和节流,然后发送通知到邮件、Pageduty或者Slack等系统中
(Bridge)网桥
网桥是一个从客户端库提取样本,然后将其暴露给非Prometheus监控系统的组件。例如:Python客户端可以将度量指标数据导出到Graphite。
(Client library)客户库
客户库是使用某种语言(Go、Java、Python、Ruby等),可以轻松直接调试代码,编写样本收集器去拉取来自其他系统的数据,并将这些度量指标数据输送给Prometheus服务。
(Collector) 收集器
收集器是表示一组度量指标导出器的一部分。它可以是单个度量指标,也可以是从另一个系统提取的多维度度量指标。
(Direct instrumentation)直接测量
直接测量是将测量在线添加到程序的代码中
(Exporter)导出器
导出器是暴露Prometheus度量指标的二进制文件,通常将非Prometheus数据格式转化为Prometheus支持的数据处理格式
(Notification)通知
通知表示一组或者多组的警告,通过警告管理器将通知发送到邮件,Pagerduty或者Slack等系统中
(PromDash) 面板
PromDash是Prometheus的Ruby-on-rails主控面板构建器。它和Grafana有高度的相似之处,但是它只能为Prometheus服务
Prometheus
Prometheus经常称作Prometheus系统的核心二进制文件。它也可以作为一个整体,被称作Prometheus监控系统
(PromQL) Prometheus查询语言
PromQL是Prometheus查询语言。它支持聚合、分片、切割、预测和连接操作
Pushgateway
Pushgateway会保留最近从批处理作业中推送的度量指标。这允许服务中断后Prometheus能够抓取它们的度量指标数据
Silence
在AlertManager中的静默可以阻止符合标签的警告通知
Target
在Prometheus服务中,一个应用程序、服务、端点的度量指标数据
metrics和labels(度量指标名称和标签)
docker 安装
docker 安装 prometheus
首先,运行prometheus容器:
docker run --name prometheus -d -p 9090:9090 prom/prometheus:v2.2.1
访问地址如http://192.168.200.142:9090/,发现可以正常访问,但是由于没有配置exporter来导入数据,暂时是没有数据的。
然后,获取默认的配置文件,方便自定义配置:
docker exec -it prometheus cat /etc/prometheus/prometheus.yml
配置文件如下:
# my global config
global:
  scrape_interval:     15s # Set the scrape interval to every 15 seconds. Default is every 1 minute.
  evaluation_interval: 15s # Evaluate rules every 15 seconds. The default is every 1 minute.
  # scrape_timeout is set to the global default (10s).

# Alertmanager configuration
alerting:
  alertmanagers:
  - static_configs:
    - targets:
      # - alertmanager:9093

# Load rules once and periodically evaluate them according to the global 'evaluation_interval'.
rule_files:
  # - "first_rules.yml"
  # - "second_rules.yml"

# A scrape configuration containing exactly one endpoint to scrape:
# Here it's Prometheus itself.
scrape_configs:
  # The job name is added as a label `job=<job_name>` to any timeseries scraped from this config.
  - job_name: 'prometheus'

    # metrics_path defaults to '/metrics'
    # scheme defaults to 'http'.

    static_configs:
      - targets: ['localhost:9090']
-
scrape_interval 这里是指每隔15秒钟去抓取数据(这里)
-
evaluation_interval 指的是计算rule的间隔
拷贝配置文件,并以映射的方式启动prometheus容器:
mkdir -p /home/docker/prometheus

mkdir -p /home/docker/prometheus/prometheus-data

docker cp prometheus:/etc/prometheus/prometheus.yml /home/docker/prometheus/prometheus.yml

docker stop prometheus

docker rm -f prometheus

docker run -u root --name prometheus -d -p 9090:9090 --restart=always \
  -v /home/docker/prometheus/prometheus-data:/prometheus \
  -v /home/docker/prometheus/prometheus.yml:/etc/prometheus/prometheus.yml \
  prom/prometheus:v2.2.1
docker 安装 mysqld-exporter
主要用于收集mysql服务器的监控数据。
准备工作:在要监控的MySQL服务器配置监控账号
create user 'exporter'@'%' identified by 'exporter';
grant process, replication client, select on *.* to 'exporter'@'%' with max_user_connections 3;
show variables like '%connections%';

-- 以下为本人的MySQL服务器配置了审计所增加的配置
grant insert on db_monitor.accesslog to 'exporter'@'%';
启动mysqld-exporter容器:
docker run --name mysqld-exporter -d -p 9104:9104 --restart=always \
  -e DATA_SOURCE_NAME="exporter:exporter@(172.20.32.37:3306)/mysql" \
  prom/mysqld-exporter

# 查看容器日志,确定容器正常运行
docker logs -f mysqld-exporter
此时访问http://192.168.200.142:9104/,就可以看到exporter导出的数据了:


接下来,调整Prometheus的配置文件,增加对mysqld_exporter数据的提取,调整后的prometheus.yml文件内容为:
# my global config
global:
  scrape_interval:     15s # Set the scrape interval to every 15 seconds. Default is every 1 minute.
  evaluation_interval: 15s # Evaluate rules every 15 seconds. The default is every 1 minute.
  # scrape_timeout is set to the global default (10s).

# Alertmanager configuration
alerting:
  alertmanagers:
  - static_configs:
    - targets:
      # - alertmanager:9093

# Load rules once and periodically evaluate them according to the global 'evaluation_interval'.
rule_files:
  # - "first_rules.yml"
  # - "second_rules.yml"

# A scrape configuration containing exactly one endpoint to scrape:
# Here it's Prometheus itself.
scrape_configs:
  # The job name is added as a label `job=<job_name>` to any timeseries scraped from this config.
  - job_name: 'prometheus'
    static_configs:
      - targets: ['localhost:9090']
        labels:
          instance: prometheus

  - job_name: 'mysql'
    scrape_interval: 15s
    static_configs:
      - targets:
        - '192.168.200.142:9104'
        labels:
          instance: db1
其中配置了部分参数的提取,完整的参数列表请参考官网。
重启prometheus容器:
docker stop prometheus

docker rm -f prometheus

docker run --name prometheus -d -p 9090:9090 \
  -v /home/docker/prometheus/prometheus-data:/prometheus-data \
  -v /home/docker/prometheus/prometheus.yml:/etc/prometheus/prometheus.yml \
  prom/prometheus:v2.2.1
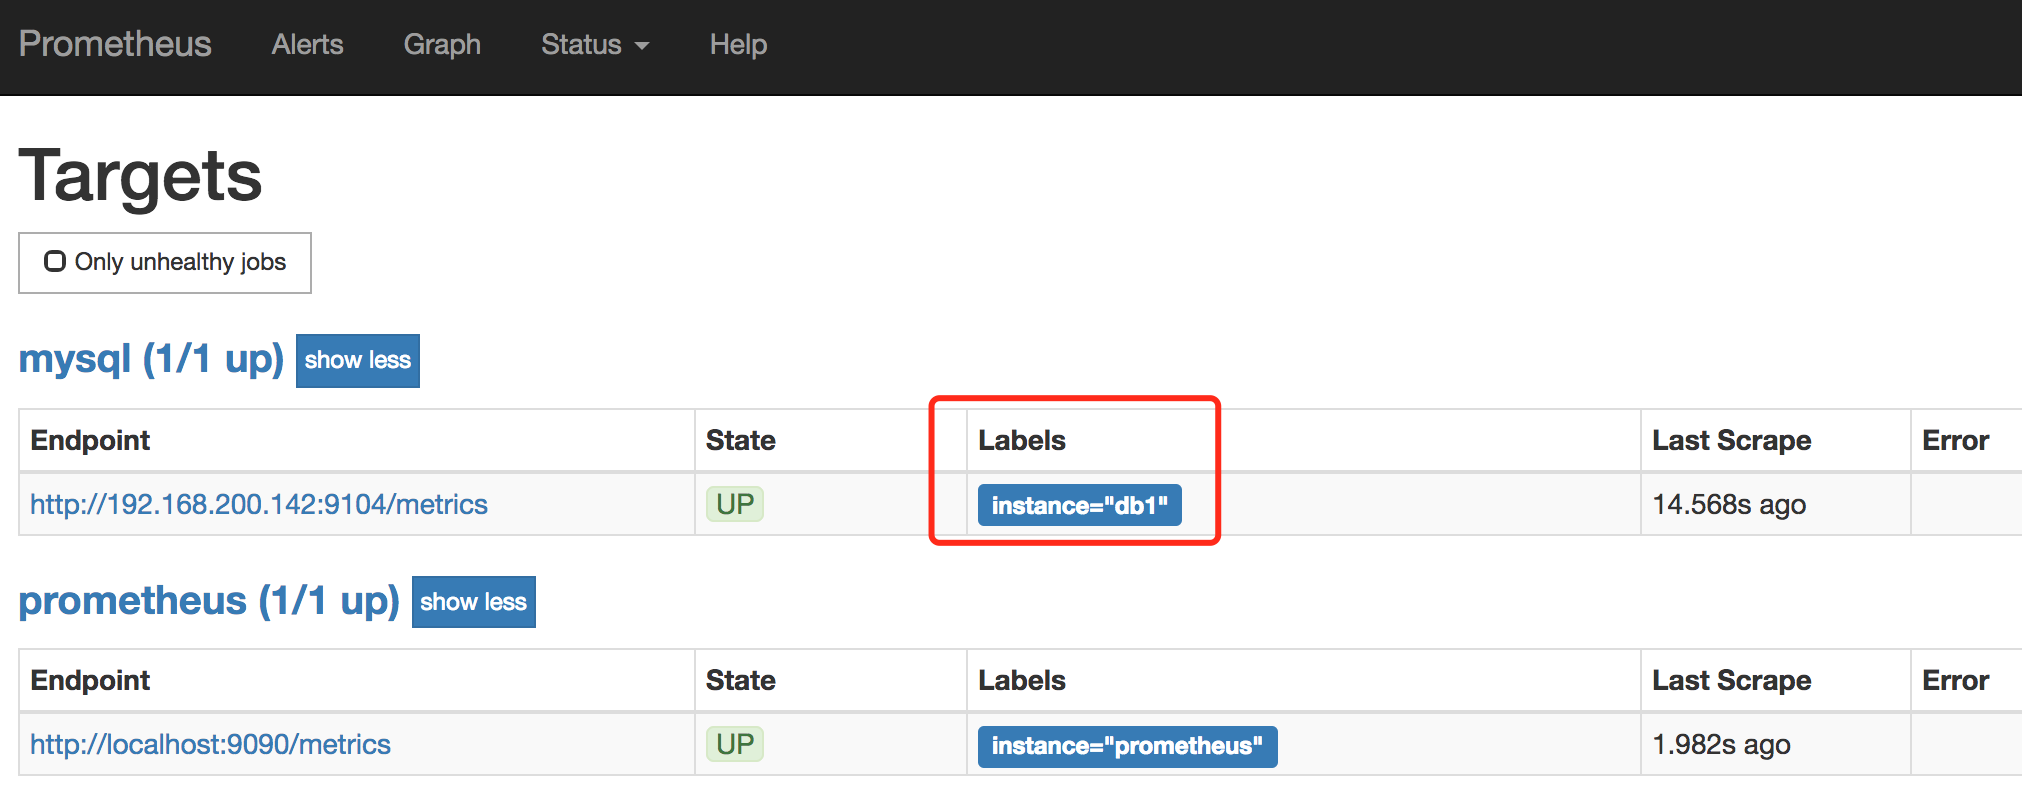
点击导航栏中的status->targets可以看到,mysql的exporter已经集成进来了。
docker 安装 node-exporter
主要用于收集服务器的基础监控数据(如CPU、内存、硬盘、网络)参数等。
docker run --name node-exporter -d -p 9100:9100 --net=host --restart=always \
  prom/node-exporter:v0.15.2
访问http://192.168.200.142:9100/,就可以看到exporter导出的数据了。
接下来,调整Prometheus的配置文件,增加对node-exporter数据的提取,调整后的prometheus.yml文件内容为:
# my global config
global:
  scrape_interval:     15s # Set the scrape interval to every 15 seconds. Default is every 1 minute.
  evaluation_interval: 15s # Evaluate rules every 15 seconds. The default is every 1 minute.
  # scrape_timeout is set to the global default (10s).

# Alertmanager configuration
alerting:
  alertmanagers:
  - static_configs:
    - targets:
      # - alertmanager:9093

# Load rules once and periodically evaluate them according to the global 'evaluation_interval'.
rule_files:
  # - "first_rules.yml"
  # - "second_rules.yml"

# A scrape configuration containing exactly one endpoint to scrape:
# Here it's Prometheus itself.
scrape_configs:
  # The job name is added as a label `job=<job_name>` to any timeseries scraped from this config.
  - job_name: 'prometheus'
    static_configs:
      - targets: ['localhost:9090']
        labels:
          instance: prometheus

  - job_name: 'mysql'
    scrape_interval: 15s
    static_configs:
      - targets:
        - '192.168.200.142:9104'
        labels:
          instance: db1

  - job_name: 'node'
    scrape_interval: 15s
    static_configs:
      - targets:
        - '172.20.32.38:9100'
        labels:
          instance: node1
重启prometheus容器:
docker stop prometheus

docker rm -f prometheus

docker run --name prometheus -d -p 9090:9090 \
  -v /home/docker/prometheus/prometheus-data:/prometheus-data \
  -v /home/docker/prometheus/prometheus.yml:/etc/prometheus/prometheus.yml \
  prom/prometheus:v2.2.1
点击导航栏中的status->targets可以看到,node的exporter已经集成进来了。
docker 安装 grafana
mkdir -p /home/docker/grafana

mkdir -p /home/docker/grafana/data

docker stop grafana

docker rm -f grafana

docker run --name grafana -d -p 3000:3000 --restart=always \
  -e "GF_SECURITY_ADMIN_PASSWORD=dockerMan" \
  -v /home/docker/grafana/data:/var/lib/grafana \
  grafana/grafana:5.0.3
然后,访问http://192.168.200.142:3000/,可以访问grafana的界面,账号密码为:admin/dockerMan。
此时,你要添加一个数据源,将Grafana和Prometheus关联起来。点击Add data source,如下填写数据保存即可:
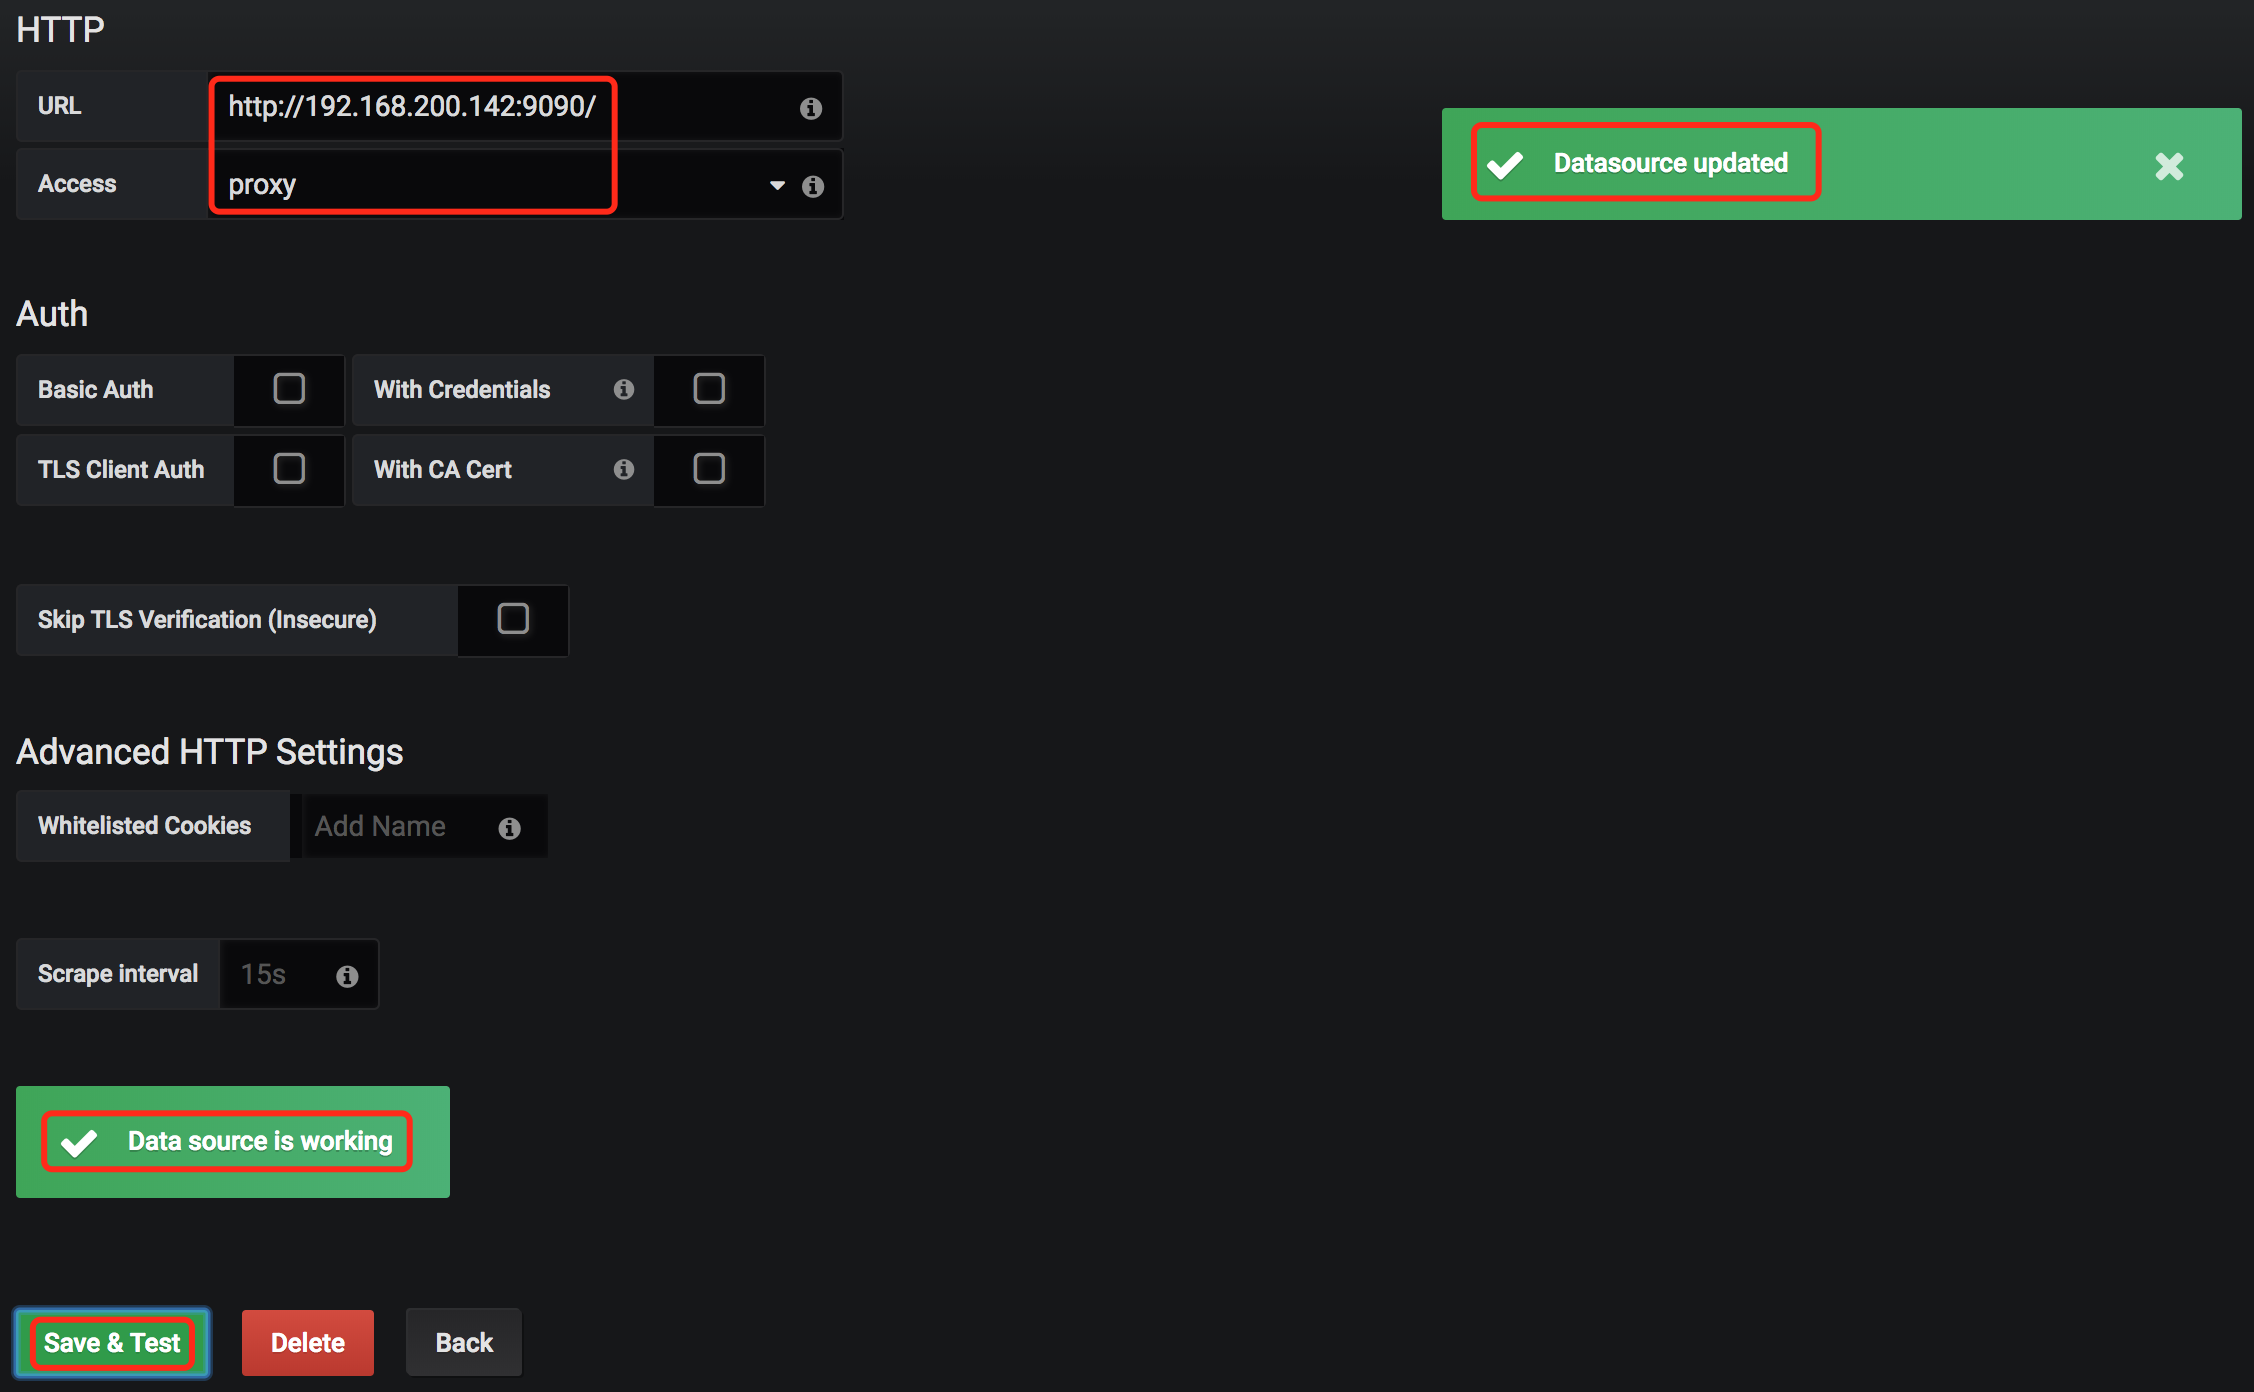
看到如上的提示,说明你的prometheus工作是正常的。
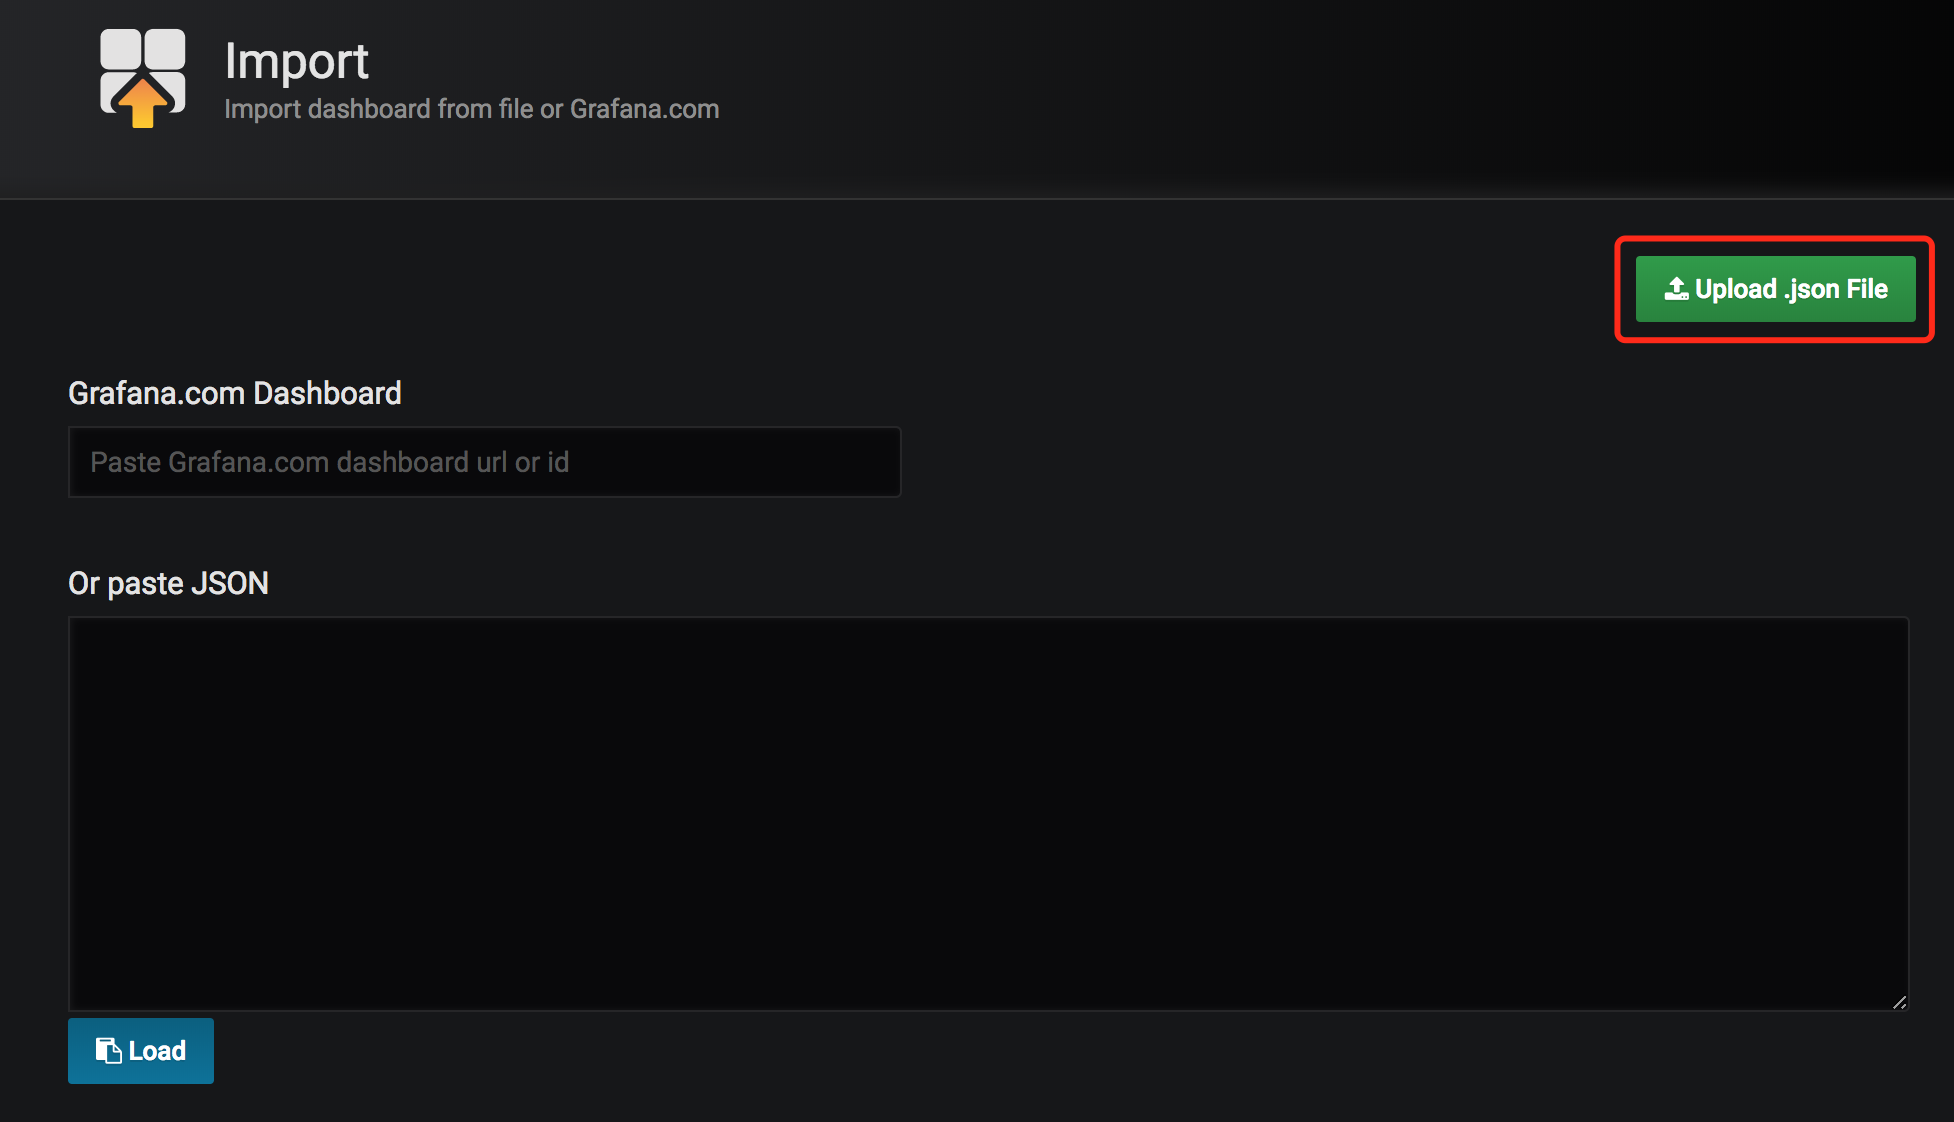
从https://github.com/percona/grafana-dashboards项目中的dashboards下载MySQL_Overview.json,然后以导入的方式将dashboard添加到grafana:
git clone https://github.com/percona/grafana-dashboards.git
Node-Exporter使用模版Node Exporter Server Metrics即可。
模版号:405、718
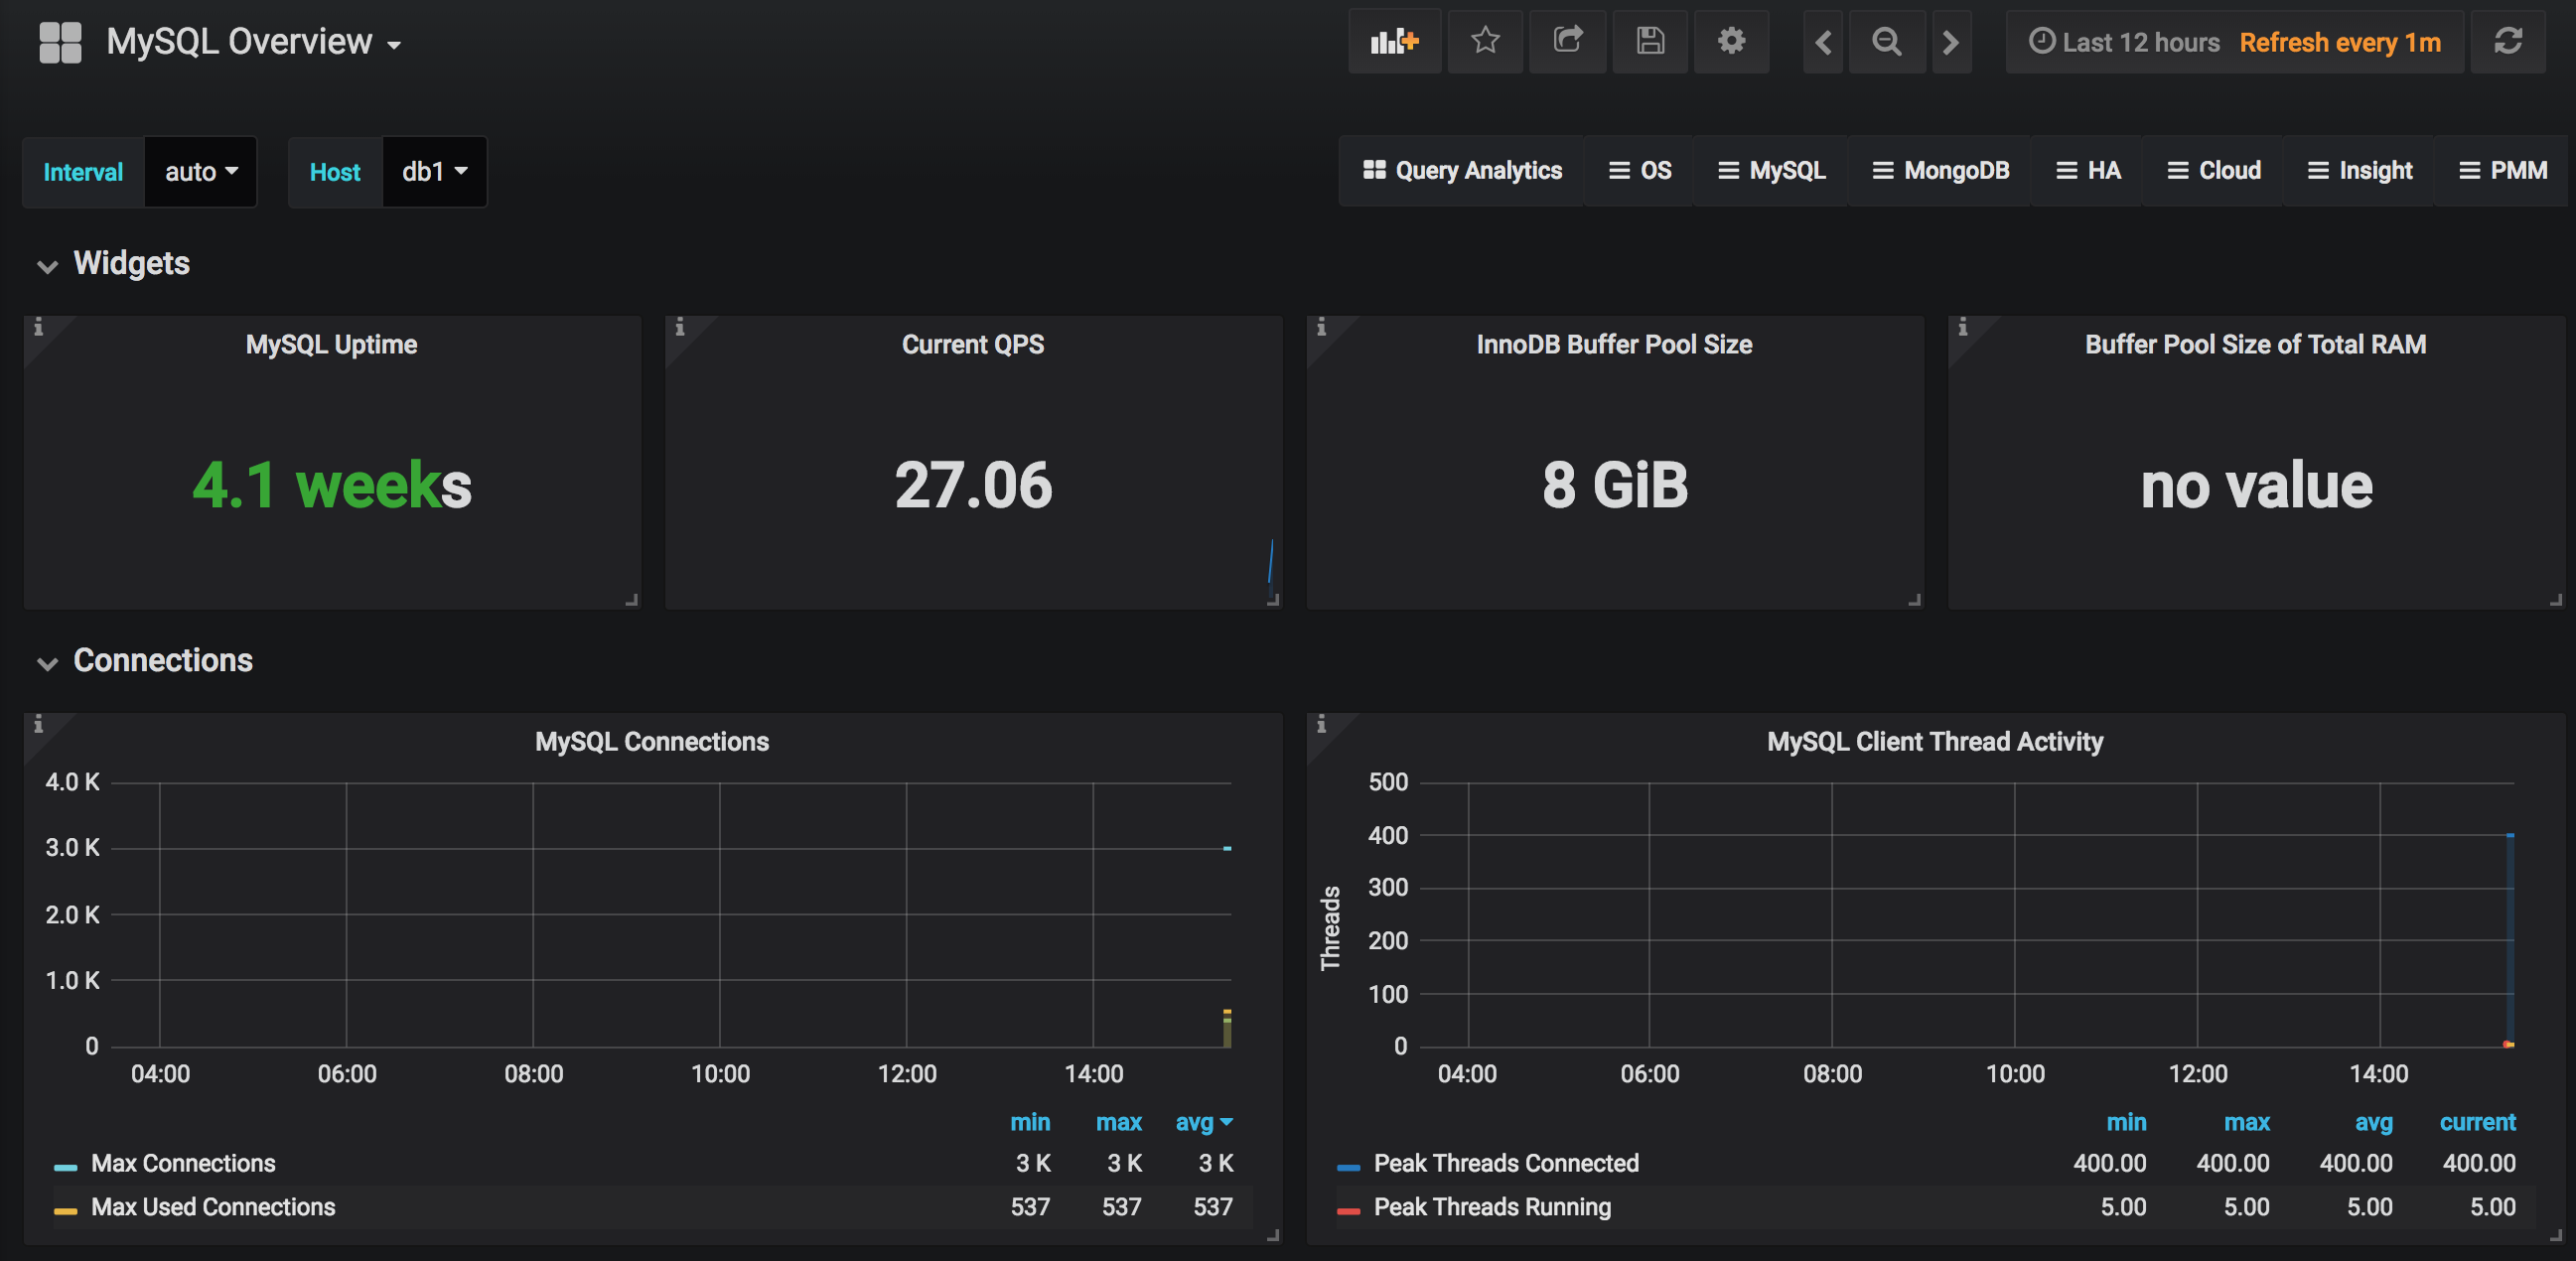
最终看到监控界面的效果如下:
docker 安装 alertmanager
docker run --name alertmanager -d -p 9093:9093 --restart=always \
  prom/alertmanager:v0.14.0

mkdir -p /home/docker/alertmanager

mkdir -p /home/docker/alertmanager/data

# 获取默认配置文件以调整参数
docker cp alertmanager:/etc/alertmanager/config.yml /home/docker/alertmanager/config.yml

# 修改默认配置文件

docker stop alertmanager

docker rm -f alertmanager

docker run --name alertmanager -d -p 9093:9093 --restart=always \
  -v /home/docker/alertmanager/config.yml:/etc/alertmanager/config.yml \
  -v /home/docker/alertmanager/data:/altermanager \
  prom/alertmanager:v0.14.0 \
  --config.file=/etc/alertmanager/config.yml \
  --storage.path=/alertmanager \
  --web.external-url="http://172.20.32.38:9093"

docker stop prometheus

docker rm -f prometheus

docker run --name prometheus -d -p 9090:9090 \
  -v /home/docker/prometheus/prometheus-data:/prometheus-data \
  -v /home/docker/prometheus/prometheus.yml:/etc/prometheus/prometheus.yml \
  -v /home/docker/prometheus/alert.rules:/etc/prometheus/alert.rules \
  prom/prometheus:v2.2.1
最终配置文件如下:
config.yml
global:
  # ResolveTimeout is the time after which an alert is declared resolved
  # if it has not been updated.
  resolve_timeout: 5m
  # The smarthost and SMTP sender used for mail notifications.
  smtp_smarthost: 'smtp.exmail.qq.com:25'
  smtp_from: 'yang.lei@belle.com.cn'
  smtp_auth_username: 'yang.lei@belle.com.cn'
  smtp_auth_password: 'xxx'
  smtp_require_tls: false

# The directory from which notification templates are read.
templates:
- '/etc/alertmanager/template/*.tmpl'

# The root route on which each incoming alert enters.
route:
  # The labels by which incoming alerts are grouped together. For example,
  # multiple alerts coming in for cluster=A and alertname=LatencyHigh would
  # be batched into a single group.
  group_by: ['alertname', 'cluster', 'service']

  # When a new group of alerts is created by an incoming alert, wait at
  # least 'group_wait' to send the initial notification.
  # This way ensures that you get multiple alerts for the same group that start
  # firing shortly after another are batched together on the first
  # notification.
  # 分组等待时间
  group_wait: 30s

  # When the first notification was sent, wait 'group_interval' to send a batch
  # of new alerts that started firing for that group.
  # 分组的时间间隔
  group_interval: 1m

  # If an alert has successfully been sent, wait 'repeat_interval' to
  # resend them.
  # 重复报警的时间间隔
  repeat_interval: 3m

  # A default receiver
  # 发给定义的 receiver
  receiver: team-X-mails

  # All the above attributes are inherited by all child routes and can
  # overwritten on each.

  # The child route trees.
  routes:
  # This routes performs a regular expression match on alert labels to
  # catch alerts that are related to a list of services.
  - match_re:
      service: ^(foo1|foo2|baz)$
    receiver: team-X-mails
    # The service has a sub-route for critical alerts, any alerts
    # that do not match, i.e. severity != critical, fall-back to the
    # parent node and are sent to 'team-X-mails'
    routes:
    - match:
        severity: critical
      receiver: team-X-pager
  - match:
      service: files
    receiver: team-Y-mails

    routes:
    - match:
        severity: critical
      receiver: team-Y-pager

  # This route handles all alerts coming from a database service. If there's
  # no team to handle it, it defaults to the DB team.
  - match:
      service: database
    receiver: team-DB-pager
    # Also group alerts by affected database.
    group_by: [alertname, cluster, database]
    routes:
    - match:
        owner: team-X
      receiver: team-X-pager
    - match:
        owner: team-Y
      receiver: team-Y-pager


# Inhibition rules allow to mute a set of alerts given that another alert is
# firing.
# We use this to mute any warning-level notifications if the same alert is
# already critical.
inhibit_rules:
- source_match:
    severity: 'critical'
  target_match:
    severity: 'warning'
  # Apply inhibition if the alertname is the same.
  equal: ['alertname', 'cluster', 'service']


receivers:
- name: 'team-X-mails'
  email_configs:
  # 收件人地址 想发送多个人可以这样写test1@qq.com,test2@qq.com
  - to: 'yang.lei@belle.com.cn'
    send_resolved: true
    html: ''
    headers:
      Subject: "[报警触发]测试环境"

- name: 'team-X-pager'
  email_configs:
  - to: 'team-X+alerts-critical@example.org'
  pagerduty_configs:
  - service_key: <team-X-key>

- name: 'team-Y-mails'
  email_configs:
  - to: 'team-Y+alerts@example.org'

- name: 'team-Y-pager'
  pagerduty_configs:
  - service_key: <team-Y-key>

- name: 'team-DB-pager'
  pagerduty_configs:
  - service_key: <team-DB-key>

- name: 'team-X-hipchat'
  hipchat_configs:
  - auth_token: <auth_token>
    room_id: 85
    message_format: html
    notify: true
prometheus.yml
# my global config
global:
  scrape_interval:     15s # Set the scrape interval to every 15 seconds. Default is every 1 minute.
  evaluation_interval: 15s # Evaluate rules every 15 seconds. The default is every 1 minute.
  # scrape_timeout is set to the global default (10s).

# Alertmanager configuration
alerting:
  alertmanagers:
  - static_configs:
    - targets:
      - '172.20.32.38:9093'

# Load rules once and periodically evaluate them according to the global 'evaluation_interval'.
rule_files:
  - "/etc/prometheus/alert.rules"
  # - "second_rules.yml"

# A scrape configuration containing exactly one endpoint to scrape:
# Here it's Prometheus itself.
scrape_configs:
  # The job name is added as a label `job=<job_name>` to any timeseries scraped from this config.
  - job_name: 'prometheus'

    # metrics_path defaults to '/metrics'
    # scheme defaults to 'http'.

    static_configs:
      - targets: ['localhost:9090']
        labels:
          instance: prometheus

  - job_name: 'mysql'
    scrape_interval: 15s
    static_configs:
      - targets:
        - '172.20.32.38:9104'
        labels:
          instance: db1

  - job_name: 'node'
    scrape_interval: 15s
    static_configs:
      - targets:
        - '172.20.32.38:9100'
        labels:
          instance: node1
alert.rules
groups:
- name: example   #报警规则的名字
  rules:
  # Alert for any instance that is unreachable for >5 minutes.
  - alert: InstanceDown     #检测job的状态,持续1分钟metrices不能访问会发给altermanager进行报警
    expr: up == 1
    for: 1m    #持续时间
    labels:
      serverity: page
      status : yellow
    annotations:
      summary: "Instance  up"
      description: " of job  has been up for more than 1 minutes."
  - alert: NodeMemoryUsage
    expr: (node_memory_MemTotal - (node_memory_MemFree+node_memory_Buffers+node_memory_Cached )) / node_memory_MemTotal * 100 > 2
    for: 1m
    labels:
      severity: warning
    annotations:
      summary: ": High Memory usage detected 可用内存不足"
      description: ": Memory usage is above 80% (current value is: "
docker 安装总结
从docker安装Prometheus到最终grafana展现的过程,可以看出Prometheus的基本监控步骤应该是:
- 配置监控抽取工具exporter
- 配置Prometheus收集exporter传入的监控数据
- 配置grafana,并导入合适的监控模版进行监控数据展示
- 配置监控告警分为2部,第一步是配置Prometheus告警规则以及alertmanager地址,然后由Prometheus来判断是否需要告警,如需要则发送告警任务给步骤为alertmanager,第二步是启动alertmanager定义告警发送配置,将告警信息发送给指定的接收者。
storage参数
storage.local.retention
用来配置采用数据存储的时间,168h0m0s即为24*7小时,即1周
storage.local.max-chunks-to-persist
该参数控制等待写入磁盘的chunks的最大个数,如果超过这个数,Prometheus会限制采样的速率,直到这个数降到指定阈值的95%。建议这个值设定为storage.local.memory-chunks的50%。Prometheus会尽力加速存储速度,以避免限流这种情况的发送。
storage.local.memory-chunks
设定prometheus内存中保留的chunks的最大个数,默认为1048576,即为1G大小
storage.local.num-fingerprint-mutexes
当prometheus server端在进行checkpoint操作或者处理开销较大的查询的时候,采集指标的操作会有短暂的停顿,这是因为prometheus给时间序列分配的mutexes可能不够用,可以通过这个指标来增大预分配的mutexes,有时候可以设置到上万个。
storage.local.series-file-shrink-ratio
用来控制序列文件rewrite的时机,默认是在10%的chunks被移除的时候进行rewrite,如果磁盘空间够大,不想频繁rewrite,可以提升该值,比如0.3,即30%的chunks被移除的时候才触发rewrite。
storage.local.series-sync-strategy
控制写入数据之后,何时同步到磁盘,有’never’, ‘always’, ‘adaptive’. 同步操作可以降低因为操作系统崩溃带来数据丢失,但是会降低写入数据的性能。 默认为adaptive的策略,即不会写完数据就立刻同步磁盘,会利用操作系统的page cache来批量同步。
storage.local.checkpoint-interval
进行checkpoint的时间间隔,即对尚未写入到磁盘的内存chunks执行checkpoint操作。
以上配置只适合老版本,新版本参数已经调整,见参考资料:prometheus 版本1.7 常用启动参数
参考资料
用 Prometheus 来监控你的 Kubernetes 集群
Kubernetes 1.6 部署prometheus和grafana(数据持久)
最佳实践Prometheus在Kubernetes下的监控实践
Prometheus监控 - Alertmanager报警模块
prometheus+alertmanager二进制安装实现简单邮件告警